


In this section, we discuss how asset classes—including stocks, bonds, gold, real estate, and commodities—perform before, during, and after recessions. We back up our observations with data that dates back to 1976. We analyze how different asset classes perform during different periods of the economic cycle.
The economic cycle can be divided into four phases: recovery, expansion, slowdown, and downturn (Appendix 1). When we talk about recessions, they lie somewhere in the downturn phase.
It is a well-established phenomenon that the performance between asset classes throughout the economic cycle is uncorrelated. In general, fixed-income instruments perform better during economic downturns, while equities rise during economic expansions. Other asset classes, such as real estate and commodities, tend to follow their own cycle, but usually have strong correlations with risky assets like equities.
BONDS
Bond prices move inversely with the economic cycle due to the cyclical movement in interest rates and the fixed-income nature of bonds. Between 1946 and 1970, corporate bond yields declined and bond prices rose in all but one downturn. With the exception of periods of stagflation in the post-war U.S. economy, the historical records confirm that the economic cycle/bond price relationship is inverse (Brocato and Steed 1998).
GOLD
Gold is a controversial asset class. It is a commodity, but it has few industrial uses, nor does it pay dividends. However, gold can act as a hedge against political and economic uncertainties. It provides a hedge against inflation, currency weakness, and financial turmoil. In addition, gold typically doesn’t move in sync with stocks or bonds, so it is a good diversifier. However, investors need to be mindful that since gold follows its own cycle and can be affected by macro events, it doesn’t necessarily provide downside protection in all drawdown periods.
REAL ESTATE
Real estate equities (REITs) offer outstanding diversification benefits relative to conventional portfolios. History shows that, relative to the overall stock market, REITs tend to exhibit less volatility and higher returns.
COMMODITIES
Commodities follow their own cycles and offer diversification and inflation hedging to a portfolio. Although the asset class tends to be unpredictable, commodities may provide positive returns over time and are usually uncorrelated to financial assets, such as stocks and bonds.
EQUITIES
Research shows that the stock market usually leads economic activity with an average time of six months. Based on historical returns, stocks typically decline toward the end of economic expansions and into the first half of recessionary periods. Once earnings expectations have been fully revised down and interest rates stabilize, stocks begin the bottoming process. Next, lower short-term rates coupled with rising expectations contribute to rising stock returns during the later parts of economic recessions (Destefano 2004; Helbling 2010). In summary, stock prices usually drop to their lowest point during the recession phase but can rebound rapidly before the recession even ends.
Looking at today’s market, from January 3, 2022, to October 14, 2022, the peak-to-trough decline of the S&P 500 was -23.87%. Investors should be hesitant about timing the cycle precisely as it is impossible to know when the market will rebound; making any mistake can be costly as the best returns come in only a couple of trading days in any given year. Typical investor behavior is to believe that the upswing must go on forever or that the recession never ends—another costly mistake. The best approach is to alter asset class weightings marginally, but not to place excessive bets upon timing the cycle correctly.
A LOOK AT THE DATA
In “Analysis of Asset Classes through the Business Cycle,” Audrius Dzikevičius and Jaroslav Vetrov collected data on how various asset classes performed throughout economic cycles occurring from 1976 to 2011. The aggregated data, as shown in Table 1, helps us decipher patterns throughout the four phases of economic cycles (recovery, expansion, slowdown, and downturn).
Table 1. Asset Class Returns throughout the Economic Cycles of 1976 to 2011
| Phase | U.S. Equity | Intl. Equity | Bonds | Gold | REITs | Commodities |
| Recovery | 1.29 | 1.92 | 0.66 | 0.68 | 1.86 | 1.16 |
| Expansion | 0.62 | 0.88 | 0.28 | 0.60 | 0.49 | 1.65 |
| Slowdown | 0.48 | 0.49 | 0.71 | 1.74 | 1.31 | 1.11 |
| Downturn | 0.48 | -0.25 | 1.14 | -0.08 | 0.70 | -1.03 |
| Returns (%) = average monthly growth of each phase. Asset class indices defined in Appendix 2. Source: “Analysis of Asset Classes through the Business Cycle”. | ||||||
Their results make sense:
- During recovery phases, risky assets perform best. International stocks are the best performers, followed by REITs and U.S. stocks.
- During expansion phases, commodities seem to fare the best among all asset classes, whereas bonds return the lowest.
- As the economy moves to the slowdown phase, gold becomes the best-performing asset class as investors tend to pile into gold when they sense potential recessions. Not surprisingly, equities (both international and domestic) are the worst-performing asset classes in slowdown phases. REITs are an interesting anomaly as they actually perform pretty well compared to equities and commodities.
- Then, during downturn phases, bonds provide the best risk mitigation, whereas risky assets such as equities and commodities return poorly. Rates are falling during these periods, driven by the Fed’s rate cuts to stimulate the economy, plus investors piling into safe-haven assets such as U.S. treasuries. Note that during this latter part of the recessionary environment, commodities are the worst performers.
- An interesting observation is that, during downturn phases, all asset classes exhibit higher volatility than in other phases (Appendix 2).
These are powerful findings as they tell a story of asset-class performance throughout the economic cycle and allow us to identify general patterns. The question becomes: How do these patterns differ when looking at the economic cycles around specific recessions? How much does asset-class performance deviate (from these general patterns) from recession to recession?
ASSET-CLASS PERFORMANCE DURING SPECIFIC RECESSIONS
In Part 1 of this series, we discussed recessions dating back to 1929. For relevancy purposes, we will here focus on three recessions: the 1981 Double-Dip Recession, the 2001 Dot-Com Crash, and the 2008 Global Financial Crisis.
Again, we will observe the four phases of economic cycles—recovery, expansion, slowdown, and downturn. However, now we will take a look at the economic cycle specific to each of these three recessions. We will examine how each asset class performs during these cycles, with an emphasis on the recessionary phases.
Table 2. 1981 Double-Dip Recession
| Phase | U.S. Equity | U.S. Growth | U.S. Value | Intl. Equity | Bonds | Gold | REITs | Commodities |
| Downturn | -7.94 | -14.41 | -2.50 | -6.81 | 10.62 | -35.11 | 3.47 | -8.99 |
| Recovery | 60.52 | 61.60 | 56.57 | 20.19 | 32.94 | 34.85 | 53.28 | 5.77 |
| Expansion | 4.90 | -0.70 | 11.00 | 16.46 | 3.06 | -15.75 | 13.07 | 12.70 |
| Slowdown | 21.67 | 19.79 | 22.73 | 43.52 | 19.80 | -4.74 | 23.47 | 1.20 |
| Returns (%) annualized for each phase. Data via Morningstar. Asset class indices defined in Appendix 2. | ||||||||
A few key observations:
- During the downturn phase, commodities and stocks underperformed, as expected. What’s surprising is that gold had a big drawdown of -35% during this period. Bonds, on the other hand, were the best-performing asset class.
- During the slowdown phase, international stocks led the way, whereas gold was actually the worst performer.
A DEEPER DIVE ON GOLD
It’s a common belief that gold acts as a hedge during economic slowdowns. However, during this 1980 economic cycle, it underperformed significantly in not only the downturn phase, but in the slowdown phase as well. The price of gold rose dramatically from late 1979 to January 1980 due to heightened inflation fears. Inflation in the U.S. had risen to an all-time high of 13% by 1979, and gold prices rose accordingly. Geopolitical tensions in 1979 exacerbated investors’ flight to safety, pushing gold prices higher. Then, gold saw a sharp sell-off starting in January 1980. Gold’s downturn through 1980 was driven in part by the Fed raising interest rates from 13% to 20% to combat inflation. Also, Silver Thursday (in March 27, 1980, when the price of silver fell by over 50%) added selling pressure on precious metals and had a spillover effect on gold, which pushed gold prices down.
Price Growth of Gold 1979–1982
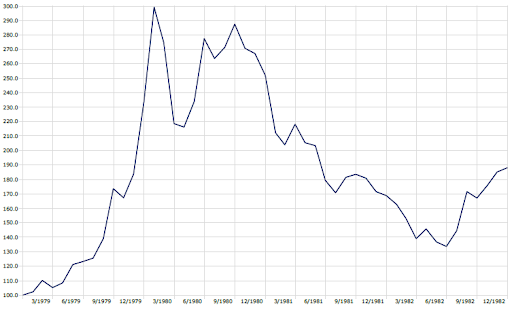
Time period: 1/1/1979 to 12/31/1982. Gold represented by S&P GSCI Gold Total Return. Source: Morningstar
It is clear that gold is impacted by extraneous events and does not always provide portfolio protection during downturns or recessionary periods as many investors believe. Macro factors such as political tension, inflation, and interest rate movements can affect gold prices dramatically due to its commodity-like nature. It acts more as a diversifier than an absolute safe-haven asset.
TABLE 3. 2001 DOT-COM CRASH
| Phase | U.S. Equity | U.S. Growth | U.S. Value | Intl. Equity | Bonds | Gold | REITs | Commodities |
| Expansion | 25.58 | 41.02 | 10.11 | 29.16 | -0.48 | -0.19 | -6.50 | 35.04 |
| Slowdown | -1.39 | -1.37 | 3.30 | -11.80 | 7.12 | -4.73 | 21.83 | 39.68 |
| Downturn | -23.51 | -40.25 | -8.98 | -24.91 | 14.05 | 2.15 | 8.59 | -20.34 |
| Recovery | 25.56 | 28.53 | 25.52 | 34.14 | 2.97 | 7.48 | 36.47 | 4.25 |
| Returns (%) annualized for each phase. Data via Morningstar. Asset-class indices defined in Appendix 2. | ||||||||
Here are some observations of this cycle:
- Risky assets did well during the recovery phase. Growth stocks outperformed.
- Commodities fared really well during the expansion and slowdown phases.
- Equities, especially U.S. growth, had the worst return during the downturn phase, and bonds were the best performers. This does not come as a surprise as the 2001 recession was led by the crash in technology stocks.
TABLE 4. 2008 GLOBAL FINANCIAL CRISIS
| Phase | U.S. Equity | U.S. Growth | U.S. Value | Intl. Equity | Bonds | Gold | REITs | Commodities |
| Expansion | 15.00 | 13.66 | 17.36 | 25.29 | 3.17 | 19.24 | 18.96 | 1.12 |
| Slowdown | -13.12 | -5.96 | -18.78 | -10.61 | 7.12 | 40.58 | -13.64 | 75.98 |
| Downturn | -30.26 | -28.86 | -32.67 | -38.27 | 4.69 | -5.08 | -42.34 | -66.50 |
| Recovery | 25.06 | 26.79 | 25.01 | 26.41 | 9.17 | 31.37 | 47.30 | 16.88 |
| Returns (%) annualized for each phase. Data via Morningstar. Asset-class indices defined in Appendix 2. | ||||||||
Key observations:
- During the recovery phase, REITs did exceptionally well. REITs experienced a sharp rebound from the deep drawdown of the real estate market in 2009, which was the root cause of the Global Financial Crisis.
- Commodities and gold had the best performance during the slowdown phase.
- REITs and other risky assets fell dramatically during the 2008 downturn phase, as the global economy suffered from the subprime mortgage crisis in the U.S. Value stocks underperformed their growth counterparts as banks and financial companies were the first to go under. Interestingly, commodities were the worst performers. Bonds were the only asset class that saw a positive return during the downturn phase.
A DEEPER DIVE ON COMMODITIES
Investors might remember REITs and the stock market being hammered during 2008, but what happened to commodities?
- The U.S. entered a recession in December 2007. The supply of crude oil increased and demand decreased during the first half of 2008. During that time, crude oil prices defied the recession and defied the laws of supply and demand by climbing an astonishing 60%. This was caused by speculations from momentum players; commodities became an asset class that institutions used to an increasing extent.
- Beginning in July 2008, the commodities bubble popped and crude oil and other commodities plummeted in price. Crude oil fell by more than $100 per barrel (75%) in just six months. Commodities ended up with a worse drawdown than equities.
Figure 1 shows the dramatic move of commodities from 2006 to 2008:
Figure 1. WTI Crude Oil Price 2006–2008 with NASDAQ 100 Overlay
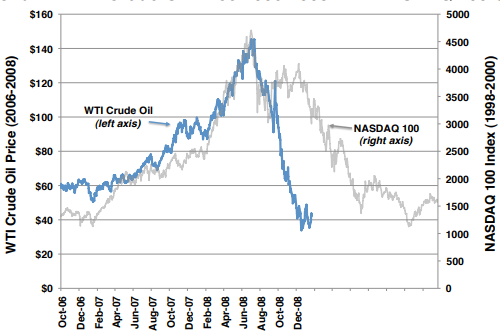
Source: Bloomberg
We can summarize our analysis of these three recessions (1981 Double-Dip Recession, 2001 Dot-Com Crash, and 2008 Global Financial Crisis) with the following observations:
- Bonds are the only asset class that gave out positive returns during all three recessions.
- Equities and REITs tend to outperform during recovery phases.
- Commodities, on the other hand, are somewhat unpredictable as they follow their own cycles. Therefore, they should be a tactical play rather than a buy-and-hold approach.
- Last, to demystify the common belief that gold is a safe-haven asset, our analysis shows that it might be a great hedge against inflation and against political and currency uncertainties, but it is still a commodity after all. Gold follows its own cycle and can experience large drawdowns during recessionary periods such as the slowdown and downturn phases of the 1980s. Therefore, abandoning other asset classes and piling into gold during recessions is a dangerous move.
In the third and final part of this series, we will discuss which past recession most resembles the current environment.
Brian Werdesheim is a founding member of The Summa Group of Oppenheimer & Co. Inc (“Oppenheimer”), a private client financial advisory team that provides wealth management services for affluent individuals and families, as well as owners and executives of private and public companies, family estates, charitable entities and some of the top tax and legal professionals who serve the business, athletic and entertainment communities.
APPENDIX
1. CLI (Composite Leading Indicators): It is an aggregate time series, which shows a leading relationship with
the growth cycles of key macroeconomic indicators, with an average lead of six months. The leading
indicator approach is the best way to predict phases of economic cycles. Typically, they are constructed to
predict the cycle of total industrial production, which is a proxy for the aggregate economy.
The below chart shows the overall CLI trend during this period. It does a pretty good job of forecasting the
economic activities.
2. Asset class index definitions:
“U.S. Equity” represented by the S&P 500 Index
“U.S. Value” represented by Russell 1000 Value Index
“U.S. Growth” represented by Russell 1000 Growth Index
“International Equity” represented by MSCI EAFE Index
“Bonds” represented by Bloomberg US Agg Bond Index
“Gold” represented by S&P GSCI Gold Index
“Real Estate” represented by FTSE Nareit All Equity REITs Index
“Commodities” represented by S&P GSCI Index
SOURCES
- “Analysis of Asset Classes Through The Business Cycle” by Audrius Dzikevicius and Jaroslav Vetrov
- Gold’s Dramatic Rise and Fall in 1980s – Why It’S Important | Seeking Alpha
The 2008 Commodities Bubble:
https://www.bettermarkets.org/sites/default/files/The%20Accidental%20Hunt%20Brothers%20-%20Part%203.pdf - Strategas Investment Strategy Report; October 31, 2022; Strategas Securities, LLC. (sector performance
during past four recessions)
DISCLOSURES
The foregoing is not and is under no circumstances to be construed as an offer to sell or buy any securities. The information set
forth herein has been derived from sources believed to be reliable but is not guaranteed as to accuracy and does not purport to
be a complete statement of all material facts relating to the security or strategies discussed. The opinions of the author
expressed herein are subject to change without notice and do not necessarily reflect those of the Firm. Additional information
is available upon request. Oppenheimer & Co. Inc. does not provide legal or tax advice. Investing in securities is speculative and
entails risk, including potential loss of principal. Investors should review potential investments with their financial advisor for
the appropriateness of that investment with their investment objectives, risk tolerances and financial circumstances.
Oppenheimer & Co. Inc. Transacts Business on all Principal Exchanges and Member SIPC
Read Part 1 here.
Contributors from The Summa Group to the content of this article:
Brian Werdesheim
Stan Yang, CFA
Savannah Pincus
Valerie Yang, CFP